

undefined
5.10 The Essentials of Futures: How to Use Charts for Better Trades
Cofinex Team
Dec 19, 2025
5 min read

In crypto futures trading, chart patterns are visual maps of market psychology. They help traders predict whether a trend will continue, reverse, or break out from a period of indecision. By identifying these formations on candlestick charts, you can set precise entry points, stop-losses, and profit targets.
I. The Three Main Categories
| Category | Market Sentiment | Trading Goal |
| Continuation | Market is taking a “breather” before resuming its path. | Join the existing trend during a pause. |
| Reversal | Momentum is fading; a 180-degree turn is likely. | Exit current positions or trade the new direction. |
| Bilateral | High uncertainty; price is “coiling” for a big move. | Wait for a breakout in either direction to enter. |
II. Top 10 Patterns At a Glance
1. Reversal Patterns (Trend Shifters)
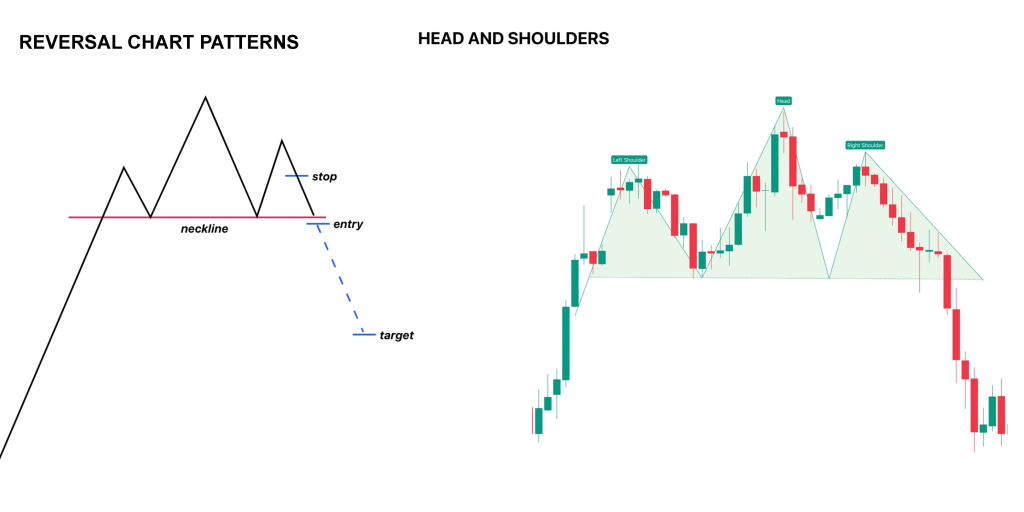
- Head and Shoulders: Three peaks, with the middle (head) being the highest. Breaking the “neckline” support signals a move from bullish to bearish.
- Double Top / Bottom: The price hits a ceiling or floor twice but fails to break it, forming an “M” (bearish) or “W” (bullish) shape.
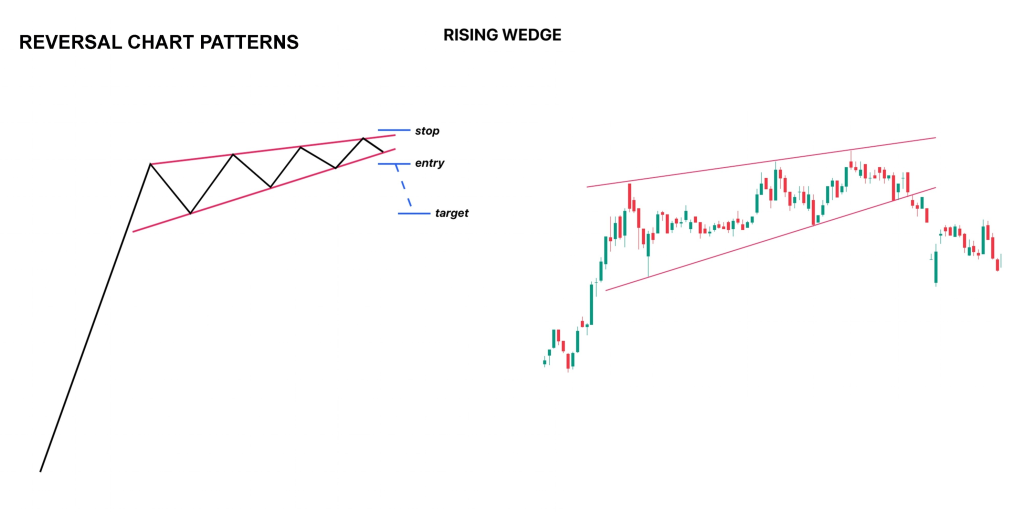
- Rising / Falling Wedges: Converging trendlines where the price is squeezed. A Rising Wedge often breaks downward, while a Falling Wedge often breaks upward.
2. Continuation Patterns (Trend Builders)
- Bull / Bear Flags: A sharp vertical price move (the flagpole) followed by a brief, rectangular consolidation (the flag). It usually explodes in the direction of the pole.
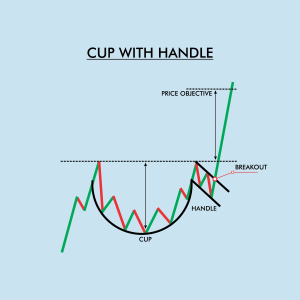
- Cup and Handle: A U-shaped “cup” followed by a slight downward drift (the handle). A breakout above the handle confirms the bullish trend.
Ascending / Descending Triangles:
- Ascending: Flat top and rising bottom (Bullish).
- Descending: Flat bottom and falling top (Bearish).
3. Bilateral Patterns (The Coiling Spring)
- Symmetrical Triangle: The price makes lower highs and higher lows simultaneously. Because the market is undecided, you trade whichever side breaks first with high volume.
III. Practical Application in Futures
- Wait for the Close: In crypto, “wicks” (the thin lines on candles) often poke out of a pattern and retract. Only enter a trade once a candle closes outside the pattern boundary.
- Confirm with Volume: A real breakout should be accompanied by a spike in trading volume. If volume is low, it might be a “fakeout.”
- The “Retest” Entry: Often, the price breaks out, comes back to touch the pattern’s edge, and then takes off. This retest is frequently the safest entry point for a futures contract.